
The Elliott wave principle became prominent in 1935 after a startling prediction that the stock market would reach a new all-time low. The Elliott Wave Analysis is one of the most complex tools of technical analysis. In this article we’ll explain the basics and explain how to perform an Elliott Wave Analysis for Bitcoin and crypto investments.
To explain the Elliott Wave Analysis for Bitcoin and crypto properly we start with an historical explanation. After that we’ll discuss the Elliott Wave Analysis in general. We will also take a look at the trustworthiness of these analyses. After that we will take a look at how to use the Elliott Wave Analyses in relation to investing in Bitcoin and cryptocurrencies.
Table of Contents
How did the Elliott Wave Analyses occur? A look back in history
American accountant Ralph Nelson Elliott proposed Elliott’s wave theory in the 1930s. Due to a health problem, Elliott was forced to retire early, which is why he studied and analyzed 75-year charts and models in various stock indexes to spend his free time. . He found that the price action, instead of acting randomly, followed an intrinsic pattern.
He also noted that the same patterns were repeated over and over again, allowing him to correctly predict the market bottom in 1935. Since then, Elliott’s wave theory has become one of the industry’s most recognized tools for technical analysis and is used by portfolio managers, traders and private investors worldwide. He suggested that, although markets behave randomly and chaotically, market prices move in specific repetitive patterns.
What is Elliott Wave Theory?
Elliott Wave Theory is a theory of technical analysis used to describe price movements in the financial market. The theory was developed by Ralph Nelson Elliott after observing and identifying repetitive patterns of fractal waves. These patterns can be recognized in stock price movements and consumer behavior. Investors who are trying to profit from a market trend could be described as riding a wave. The refinancing wave is a wave of refinancing homeowners who want to replace their existing mortgages with new ones on better terms.
What are the characteristics of the Elliott Wave Analysis?
Elliott Wave Theory is known as a form of technical analysis that seeks long-term recurring price patterns associated with constant changes in investor mood and psychology. The theory identifies impulse waves that set the pattern and corrective waves that oppose a larger trend. Each set of waves is nested in a larger set of waves that adhere to the same pulse or correction pattern, which is described as a fractal approach to inversion.
What are the principles of the Elliott Wave Analysis?
Some technical analysts try to exploit wave patterns in the stock market using Elliott’s wave theory. This hypothesis says that stock price movements can be predicted because they move in repeated up-and-down patterns called waves generated by the psychology or mood of investors.
The theory identifies two different types of waves: driving waves (also called pulse waves) and corrective waves. This is subjective which means that not all traders interpret the theory the same or agree that this is a successful trading strategy.
Unlike most other pricetrainings, the general idea of wave analysis itself does not come down to regular in-flight training where you just follow instructions. Wave analysis provides insight into trend dynamics and helps you to better understand price movements.
Elliott’s wave analyses are based on impulsive and corrective waves. We’ll explain the characteristics of both waves and how to recognise them.
What are the characteristics of the Impulse Waves?
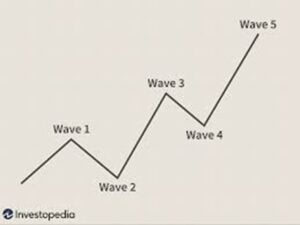
Impulse waves consist of five subwaves moving sharply in the same direction as the trend of the next highest degree. This pattern is the most common wave pattern and is the easiest to spot on the market. Like all motif waves this consists of five subwaves and three of which are also motif and two are corrective. This is structure 5-3-5-3-5, shown below.
 The 4 characteristics of a classic Elliott Wave Analyses impulse wave are as follows:
- This has three unbreakable rules that can define its formation;
- The second wave cannot return more than 100% of the first wave;
- The third wave will never be the shortest of waves one and three with five;
- The fourth wave cannot cross the third wave at any time.
If any of these rules are violated, the structure is not a pulse wave. The trader should rename the alleged impulse wave.
The other basic wave patern is the pattern of corrective waves which we also explain.
What are the characteristics of the corrective wave?
Corrective waves are sometimes called diagonal waves which consist of three and combination of three pranks that move sharply in the opposite direction to the trend of the next higher degree. Like all driving waves your own goal is to move the market in the direction of the trend.
The corrective wave consists of five subwaves. The difference is that the diagonal looks like a wedge that expands or contracts. Diagonal sub-waves also may not count to five and depending on the type of diagonal observed. As with the drive wave, each diagonal scum never fully returns to the previous scam, and scoundrel three on the diagonal may not be the shortest wave.
These pulse and corrective waves are intertwined into a self-fractal to create larger patterns. A trader with this interpretation of the Elliott wave may have long-term bearish prospects with a short-term bullish outlook.
Impulse waves VS Corrective Wave Patterns
Let’s see in a little more detail how each of these tools can be used for technical market analysis. Impulse waves are the real engines of change, and repairs are the source of those jumps. Often by turning the market up to 80%, understanding and properly recognizing the corrective wave allows us to find the right time to take market positions. While momentum or bullish waves are always the markets we want to sell. The traditional stock market seems to show variations in the Elliott wave principle and its ability to detect sentiment relative to crypto markets, it simply seems that crypto markets express a pull up and down, more importantly and exaggerated. We can see why the low liquidity and scarcity of 24/7 markets like cryptospace create such strong waves and patterns.
When it comes to financial markets and technical models, there is a saying “what goes up must come down”. This refers to the fact that when the price movement is down or up, it is always accompanied by the reverse movement. The main price direction is indicated by trends, while corrections go against the direction of the trend.
Using some of these guidelines and cycle theories, we can now take our investment to the next level by equipping ourselves with tools to more carefully identify the ups and downs of the market cycle.
What are the advantages and disadvantages of using Elliot Wave Analyses?
As every analysing methodes the Elliott Wave theory has some clear advantages that can help an investor to investigate his or her investment possibilities. On the other side there are, as there are for every analysing method, some disadvantages which we’ll discuss.
What are the 4 advantages of Elliott Wave Analyses?
First we discuss the five clear advantages. These are:
- By identifying the “third wave” you can determine not only the movement but also its entry point;
- With the Elliott Wave Oscillator, you can easily find where wave 5 and wave A end.
- The theory is easy to extend to any time period. But when using Elliott’s wave theory, we recommend starting with a one-hour time frame;
- On top of that theElliott Wave Theory is the perfect way to know only the existence of a trend but also its strength (when a stable movement is formed).
Is there any disadvantage?
On the other hand there are some disadvantages to keep in mind. These are as follows:
- Wave theory is easy to observe from a historical point of view, but can hardly be applied to real markets today;
- Impulse waves can propagate over time, which means that some players will leave before the movement is complete.
- Within a large wave there are several small ones, which can lead to misinterpretation of the graph.
- Also, keep in mind that the results obtained can be difficult to interpret, and the general analysis can also be complicated by market noise.
How to apply the Elliott Wave Analysis in Bitcoin and crypto investing?
When applying the Elliott Wave Analysis to investing in Bitcoin and crypto we can determine three types of so-called crypto waves. Let’s explain.
Three types of Elliott crypto waves
Elliott wave patterns as discovered by Ralph Nelson Elliott are constantly recurring. Elliott observed that waves can split into smaller waves and adding larger waves (wave degrees). Markets are “fractal” in nature with mathematical structures repeating themselves at all levels.
Let’s look at the behavior of cryptocurrencies in each type of market:
1. Trend waves: Crypto waves are advancing in a clear direction (up or down)
• There are 5 cryptocurrencies of Elliott Waves (12345).
• Waves 1, 3 and 5 show progress.
• Waves 2 and 4 are corrections within a trend.
• The price is usually fast, which is called impulsive.
• The price rises or falls sharply.
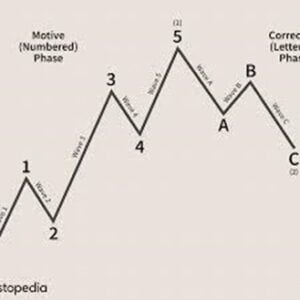
2. Countertrend waves: the waves move in the opposite direction from the trend
• There are 3 Elliott Waves (ABC) cryptocurrencies.
• Waves A and C are counter-trend.
• Waves B is the last failed attempt at a trend.
• The price is generally slower, which is called a fix.
• The price moves sideways and less up or down.
3. Range waves: Waves often turn and change direction.
• There are at least 3 waves.
• But more cryptographic waves are possible if the correction is long and complex.
• Corrections can easily become complex as the market remains hesitant.
• Simple ABC updates are part of larger WXY corrections.
Since these principles are presented often in a graphical way will explain more about the Elliott wave graphs
Explanation of Elliott wave graphs
In order to explain the Elliott wave graphs in an appropriate way we’ll show you a standard Elliott Wave Analysis graphic below.
Let’s look into these graphics. For a start Elliott’s wave theory is no different from Dow’s theory, which also recognizes that market prices fluctuate in waves. However, Elliott also highlighted the fractal nature of the market, which allowed him to analyze them in much more detail.
In mathematics, fractals are structures that are repeated over and over again on a smaller and smaller scale. Elliott noticed similar structures during his study of stock indexes, prompting him to discover how to use these models to predict market movements. Since waves are fractals, there are theoretically degrees above nine cited by Elliott.
On an Elliott wave chart, we usually see five waves moving in the direction of the main trend. These waves form what is called a pulse wave, while the next three waves move against the current and form a corrective wave. This basic pattern of 5-3 remains constant in all classes, although the range of each may vary.
How accurate is Elliott’s wave theory?
The Elliott Wave Theory is AJ It gained much of its popularity in the late 1970s. Frost and Robert Prechter released the now well-known title “Elliott Wave Principle: The Key to Market Behavior”. The book foresaw the bull market in the 1980s, and Prechter even issued a sales recommendation just days before the 1987 crash.
Elliott Wave International is known as one of the largest independent financial analysis companies in the world, and many of its market forecasting tools are based on the Elliott Wave principle. Nevertheless, Elliott made sure to clarify that the observed patterns do not provide any certainty about potential market developments and are best used in combination with other indicators of technical analysis to identify the best opportunities.
How do you apply Elliott Wave analyses with other technical analyses?
A lot of investors use other technical analyses in combination with the Elliott Wave analysis. Hereafter we discuss the Elliott Wave analyses in relation to the Fibonacci Retracement and in relation to the Elliott Wave oscillator.
Elliott Wave and Fibonacci Retracement
Traders may also interpret Elliott Wave structures differently, creating additional uncertainty in the market. Elliott also realized that targeted wave prices were perfectly aligned with Fibonacci retraction levels, and traders even identified relationships between Elliott’s wave cycles and different Fibonacci ratios.
Elliott wave oscillator
Over the years, analysts have developed a multitude of indicators inspired by the Elliott wave principle, including the Elliott wave oscillator. This oscillator provides traders with a computer-generated model that predicts potential price action based on the difference between two moving averages. The EWAVES artificial intelligence system, developed by Elliott Wave International, works according to all the standard rules of Elliot’s wave theory and automatically generates analysis.
The 2019 analysis predicted that the price of Bitcoin would reach $ 27,000 by the end of 2020. On December 31, 2020, BTC closed at nearly $ 29,000. These analyzes are useful not only for intraday traders, but also for institutional investors and traders entering derivatives markets.
How to use Elliott Wave in crypto markets
As with most technical analysis tools, there are some nuances in using Elliott’s wave theory in cryptocurrency markets, especially because of the irregularity and volatility of their price movements. In most cases, the start of the first wave is an ideal entry point. However, this can be difficult to identify, especially after a sharp market downturn or long periods of consolidation. Instead, it is much easier to get to the bottom of wave 2 or wave 4 and avoid the peaks of wave 3 and 5.
As for the exit points, the end of wave c is usually the ideal choice. Again, this can be extremely difficult to notice, as the last waves of the cycle can usually return to 100% of the original 5-wave pattern. The general advice is to wait for the period of consolidation which will go beyond the trend line produced by the latest wave of correction.
How to trade Elliott’s wave theory?
Imagine a trader noticing that a stock is moving upward in a wave of momentum. In that case, they can stay in action until you complete your fifth wave. At this point, expecting a turnaround, the trader may be below stock. Behind this business theory lies the idea that fractal patterns are repeated in financial markets. In mathematics, fractal patterns are repeated on an infinite scale.
Does Bitcoin follow Elliott’s waves?
In the decade since the inception of Bitcoin, analysts have closely monitored its market performance to indicate its future trends. Bitcoin would follow the pattern of Elliott’s wave cycle all this time. The price of Bitcoin has risen from $ 0 to $ 32 in less than a year since its launch, and the first users made big profits on the first big sale of Wave 2.
Since wave 2, Bitcoin has stuck firmly to the beginning of the Elliott wave, with wave 2 retreating by only 38.2% and wave 3 ending roughly like wave 1. Wave 5 ended at about 70% of wave 3, reinforcing the rule of the third the wave is never the shortest of five.
While this is one of the most useful instruments in the trading world, which gives investors an advantage in predicting market sentiment, it is important to understand that the fractal structures seen during these movements do not imply that markets are completely predictable.
Conclusion:
Elliott wave principle is very much more useful as a tool for making a more informed purchase decision based on where the price is of different stages of the cycle rather than as a prediction of price movements. Buying and selling assets in any financial market carries risk, so be sure to research before you spend money. Elliott’s theory of waves is a analysis that has stood the test of time. It intrudes on the unconscious collective psychology of market participants to extract predictable information about the future of the investment, and this is a highly underestimated perspective. Cryptocurrency markets are more driven by sentiments than any other financial market. Having a clear, plausible idea of the likelihood of market change is like introducing a gun into a knife fight.
Elliott’s wave theory is something that continues to provide a sense of structure to markets to many people around the world. The ability to constantly change theory when a rule is broken can make it difficult to use theory as a means of placing trades. However, it also adds a significant degree of clarity to the art of pattern recognition. How much complexity a trader wants to add to Elliott’s initial rules depends on him, but it’s certainly a method that many choose to put at the forefront of their marketing strategies.
Executing the Elliott Wave Analysis in practice
So now we know the basics of the Elliott Wave Analysis in Bitcoin and crypto we can start to use the benefits of this analysis in practice. Therefore we have determined 4 steps to make the most out of your analysis.
- Be aware of the current market: In order to make sure you are aware of the current market it’s important to know the actual prices. Here you can find the live Bitcoin and crypto prices on any given moment.
- Choose the right trading partners. If you want to perform spot trading in currencies like the Euro, Bitvavo will be our favorite pick. If you want to trade in dollars, GBP or if you want to engage in advanced trading we suggest Huobi exchange.
- Furthermore it’s important to realize that crypto trading goes on 24 hours a day and 7 days a week. Due to the volatility of the market prices can rise and fall quickly. In order to avoid the chance of missing out any opportunities or severe losses you can choose to automate trading by using a trading bot such as Cryptohopper. This supplier also provides automated trading strategies in case you don’t want to develop your own trading strategie.
- If you want to dig deeper into the world of Elliott Wave Analysis you can check out the website of the official inheritance of Mr. Elliott here.


